Real Client Work
These samples come from real client work, but they have been pixelated for confidentiality. My apologies, what I really need to do is put together some reports using artificial data. One day, soon, I will. Lacking that, I was able to pull these samples together.
I will present five reports that cover a variety of needs. They’re straight-up business reports, nothing exciting, but much care went into perfecting these. I will explain what is special about each one. Here are the five I will present:
- IRS Form 1095-A
- Gantt Chart
- Auto-generated Excel workbook
- Collections Report
- Single Page Financial Report
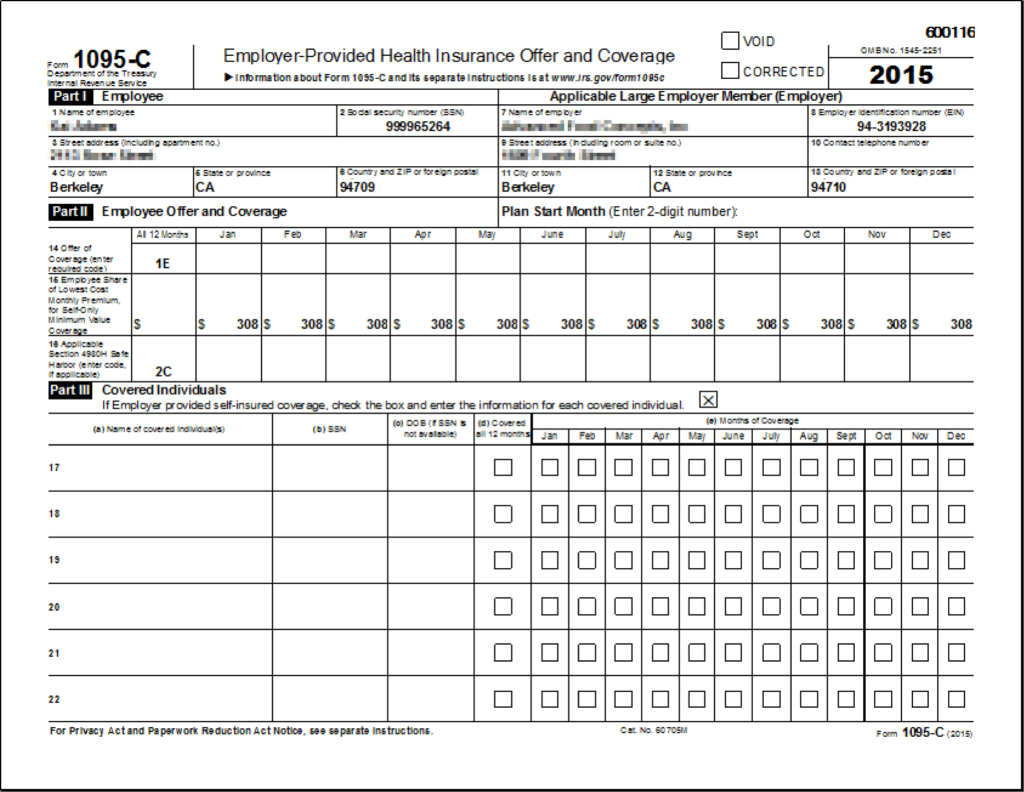
Report Example: IRS Form 1095-A
Earlier I said nothing exciting, and you can’t get any less exciting than an IRS form, right? This is a report that I made for a software vendor who built an application to handle the year-end reporting requirements for the Affordable Care Act. It was my responsibility to not only build this report, but I also created the ETL process that determined what code to put into each box per form recipient.
The output of this report had to be pixel perfect. It was generating actual IRS forms that were mailed to the employees.
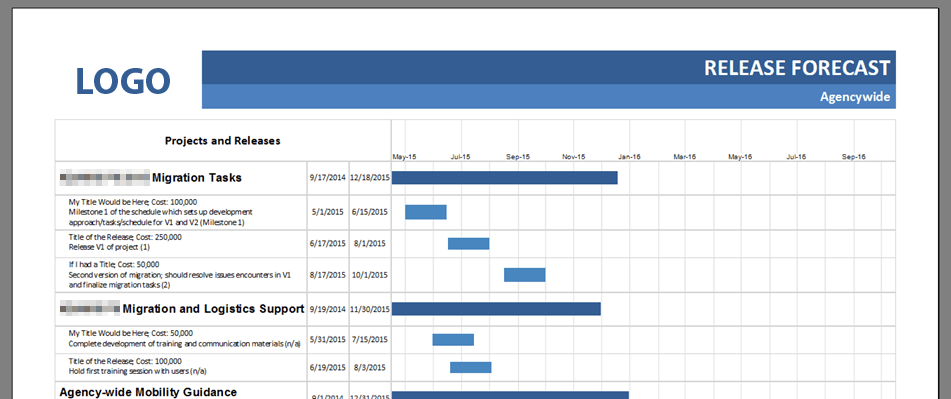
Report Example: Gantt Chart
I completed this report using SSRS, and you can see the results are good — proving this is technically possible, but it was not easy to do. I would recommend against doing this in SSRS if it can be avoided. There are better means to build Gantt charts with Tableau. For this one, my client was also a software vendor, and their client was a USA governmental regulatory agency.
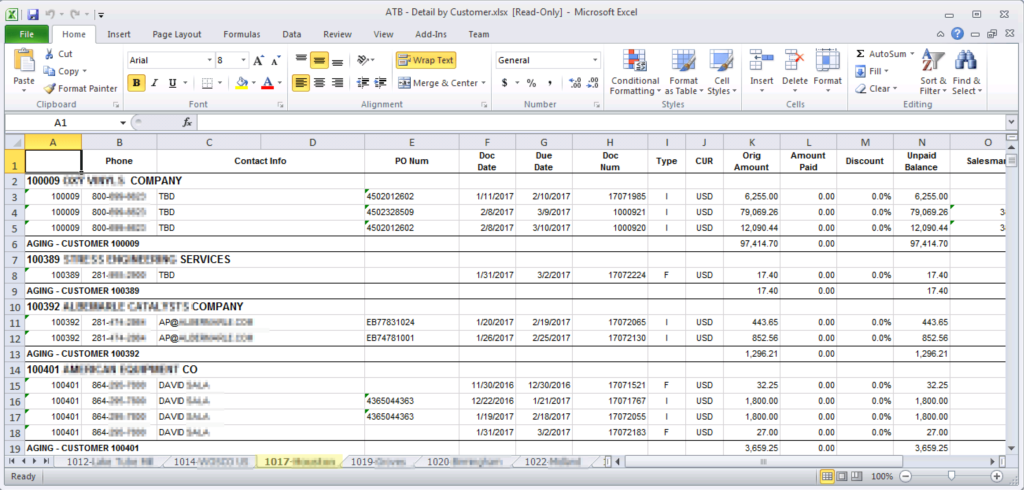
Example: Auto-Exported Excel Workbook
This one is a little different in terms of sample reports. The output delivered was an Excel workbook with multiple tabs, dynamically generated. To do this, I created an SSRS report and a subscription that would automatically write the Excel file on a networked share.
Example: Collections Report
Here is another plain-vanilla example, but the solution itself was noteworthy. This report is one page of a two page solution to automate the collections process. I developed the ETL to create a batch of accounts in collection, and aged each account into the correct buckets (current, over 30 days, etc.). Then I generated two reports:
- The collection statement (shown below)
- Cover letter (like a mail merge)
The two reports were processed with two different subscriptions. The first was output to files that could be printed and mailed. The second was delivered by email to the customers having collection accounts. Just like the other examples, my effort was not limited to creating the report itself. I also developed the data processes to generate the batch of customers and consequently “deliver” the output.
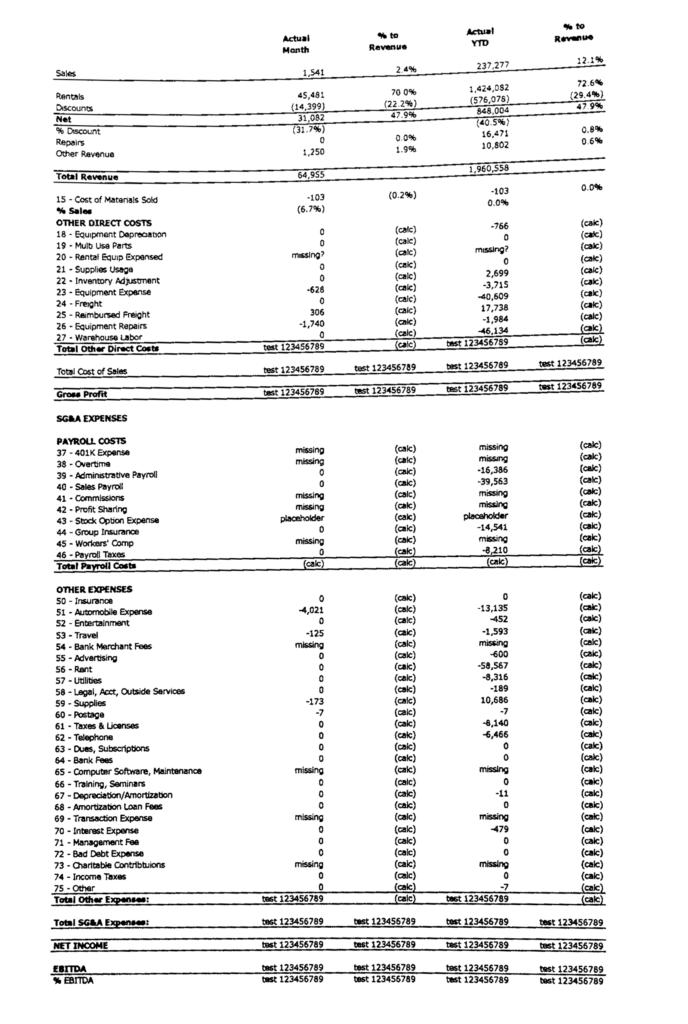
Example: Profit & Loss Statement
Pardon the condition of this last example. I never did get a proper screenshot of it, but as part of the testing I had to print it to a Laserjet. I took a photo of that and sent it to the project manager, and that is all I have to show (and my photo was distorted and crooked, too!). Despite the ugliness of the image, I still think this is a great example of my capabilities. In this single-page report, I am dynamically building an actual Profit & Loss Statement. This solved a very large problem for the client.
They had data in an ERP application and they also a separate accounting package. Creating “real” financials involves a manual import between the ERP and the accounting package. That is just fine to produce quarterly reports. They could live with that, four times per year. However, they wanted to have more frequent review of the P&L, and they didn’t want to burden the accounting staff with the extra work to produce that on demand. Therefore, I created a process to stage combined data for the P&L, plus I designed the logic to build the P&L, including the dozen or so summaries it contains. So please excuse the image quality, understanding the complex nature of the solution. Thanks!