
Going from Raw Data to Reports in the Inbox
This SSRS Case Study provides a brief overview to a very large effort. The work was preceded by a 97-page design document which spelled out the project requirements. (I did not write the requirements document.) As a case study, this provides an overview of the entire reporting solution. This page does not present a portfolio of reports. If, instead, you are looking for sample reports I have made, please go to the following link:
https://majorleaguereports.com/freelance/ssrs-developer/sample-reports/
This project contained three main areas of focus. Each is listed below and then explained, respectively, through this case study.
- Develop SSIS Packages to Perform ETL
- Create SSRS Reports
- Subscription Management Web Application
SSIS Packages

The SQL Server Agent displays the ETL jobs that are scheduled on this server. Notice the naming convention used which keeps similar jobs together. Small details like this can go a long way.
The data going into these reports had to be brought together from various sources. The generic term for this is “extract, transform and load” which is normally stated as “ETL.” The ETL tasks were completed using SSIS and scheduled to run with the SQL Agent. Some of the SSIS jobs ran daily and weekly, but the job that imported raw call records from the Cisco Call Manager had to run more frequently, otherwise it would fall behind and have problems catching up. Therefore, the call records were imported every 10 minutes into a raw, unprocessed SQL table. Then the unprocessed call records in SQL would be transformed once every 24 hours, prior to the publishing of the daily reports.
The thorough design document accounted for many details, but there were some complications with the ETL tasks, dealt with as they surfaced:
- The export of Cisco devices required a human to complete (once per week). This made it necessary to add some auditing tasks before and after the import of device records. Errors were logged to a table that the I.T. department monitored for follow up by the help desk.
- Date and Time information was stored to various standards, depending on the source, and it had to be normalized to GMT by a variety of rules depending on the source of the data and even the time of year (during/after daylight savings and whether or not the locale observed it). Some reports normalized time to “business hours” and even the storage of operating hours per location was complicated by this.
- The business rules for call classification had to be rewritten using test calls and ad hoc reports. This was due to the fact that the deployment of Cisco Call Manager was happening concurrent to the reporting project.
In order to accomodate future changes, the SSIS jobs call stored procedures for things like call classification. This way, it’s easy to make small changes to the call classification rules without making changes to the SSIS packages themselves. Also, the stored procedures can be called, run on other data sets of call data outside of the automatically processed call records.
SSRS Reports
A strategy of keeping the SSRS reports, themselves, fairly simple was taken for the purpose of recognizing that there could be changes to code in the future. It’s sometimes a challenge to maintain various versions of SQL code (sometimes similar) in various SSRS reports, and for that reason all of the report logic was contained in stored procedures instead of writing into SSRS datasets. Now, post-implementation, it’s possible to make a change in reporting logic without opening/saving SSRS objects. It’s faster and easier this way.
Basically, the SSRS reports for this project are just design templates. There isn’t much logic contained in them more than formatting and spacing. Even reports that used pivot tables had their pivoting done in SQL, to avoid having much logic inside of SSRS. That is not always a good idea, but it suited the design needs of this project very well.
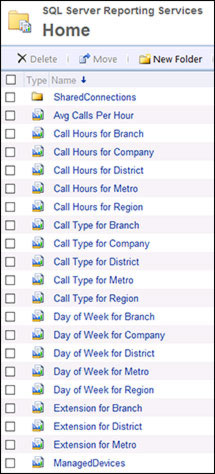
While the majority use of these reports is to receive them via email, it’s possible to call up any of these reports on-demand by using the SSRS web interface (see the image to the left). Clicking any of the reports by name allows a user to enter parameters such as the Location ID and the frequency. Upon entering the parameters, a report is generated on-screen that could then be exported as PDF or XLS.
Subscription Management
I created a simple web application that allowed administrators to either bulk import an Excel file or insert/manage one subscription at a time. A single subscription consisted of the following information:
- user name
- email address
- report name
- frequency of report (daily, weekly, monthly)
- location to report on (i.e. branch ID, district, region or entire company)
The bulk import feature was important because sometimes a single user would have more than 20 subscriptions. Still, it was possible to edit all subscriptions via a web interface as shown in the screen shot depicted here.
All reports were delivered via email with the report being in the body of the email. This can be done other ways, too, such as with an attachment or with a weblink to the report (or a combination of those). The report subscriptions, a feature built into SSRS, used parameters of location ID and report frequency to customize the report per each delivery. All of those parameters are editable using the web application I created.
Project Completion
This project took about four months, start to finish, before it was ready to go live. Since it went live, I have accommodated small requests for changes in the reports and changes in the call classification code. Each request has been very easy to achieve because of the way that the reports were designed and the stored procedures were written.

This report, “Call Type for Company” also continues on past the company totals to show tables of data per regional unit.
Fixed Price Agreement
This project was completed for a fixed price with payment milestones along the way. Large projects such as this are sometimes done at a fixed cost because the client wants to budget a fixed amount. From my perspective, a project of this scale has some tasks that take longer than expected but that is balanced out by some tasks also taking shorter than expected.
Now that the project is complete, this client pays an hourly rate for any changes they need, and I complete them within a day or two.
If you have questions about a reporting project like this or just need to kick around some ideas about your data, please contact me.
email: chris@majorleaguereports.com
phone: 407-865-4940