Disclaimer: I can’t answer this question without over simplifying things. That will make my answer technically inaccurate sometimes, and I will ignore details that might cause you angst if you’re already an expert/enthusiast. Like all of the content on this website, it’s written for non-technical audience. Thank you.
Let’s start at the end, but I will need to cover some history about this technology in order to point out its strengths. There is growing interest in SSAS Tabular largely because of Power BI. Data modeling in Power BI and in SSAS Tabular are actually the same; both use the same Vertipaq engine.
You don’t need to know much about the engine. When it’s mentioned, it’s usually to point out one of these details:
- it’s fast (because it stores all of the data in RAM)
- the same engine is behind SSAS Tabular and Power BI
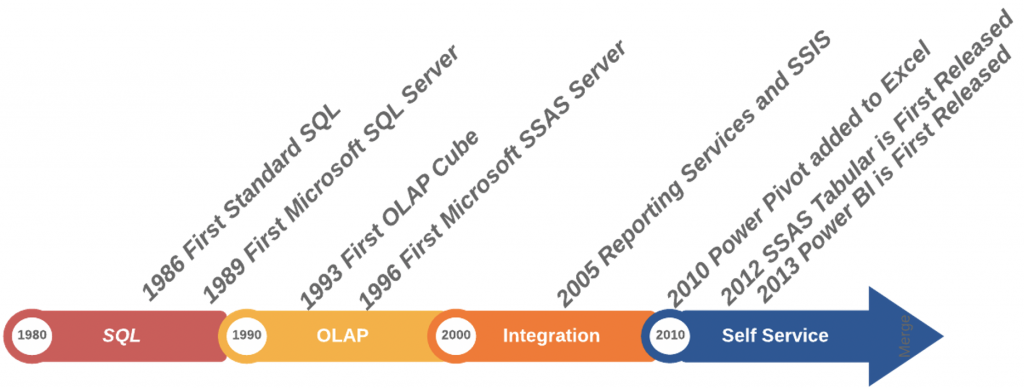
- Power Pivot, an Excel add-on from 2010 was the precursor to Power BI and SSAS Tabular
While SSAS Tabular shares the same engine as Power BI, it does not replace all of the functionality of Power BI. SSAS Tabular is only a back-end technology, and you still need to use a reporting tool with it.
The most common front-ends to SSAS Tabular:
- Power BI
- Microsoft Excel
Here is something else that SSAS Tabular shares with Power BI (and Excel). The DAX language. DAX is a funny thing, it’s the gateway to tremendous capabilities, but it’s also a source of frustration and confusion among many users. DAX can be used for very simple expressions that are quite like Excel expressions, such as converting a date (2020-08-28) into day of the week (Friday), but the real power of DAX comes in its ability to define measures.

I already mentioned the pre-cursor to SSAS Tabular, Power Pivot. Before then, there was only one type of Microsoft SQL Server Analysis Services technology, multidimensional. SSAS Tabular has not replaced multidimensional, but SSAS Tabular is a product for this time. I’ll explain.
The older SSAS platform was built to solve the problems of the day:
- Data warehouse strictly in SQL could not perform well enough for analytical demands
- Disk space was a newly available resource (1970)
- RAM was not available in abundance
- Neither was processing power
- The solution was to create cubes of data, calculate all the intersecting data points and store them on the disk
Contrast that to the modern environment:
- RAM is abundant
- So is processing power
- Put all of the data in RAM
- Calculate the value of measures only when needed
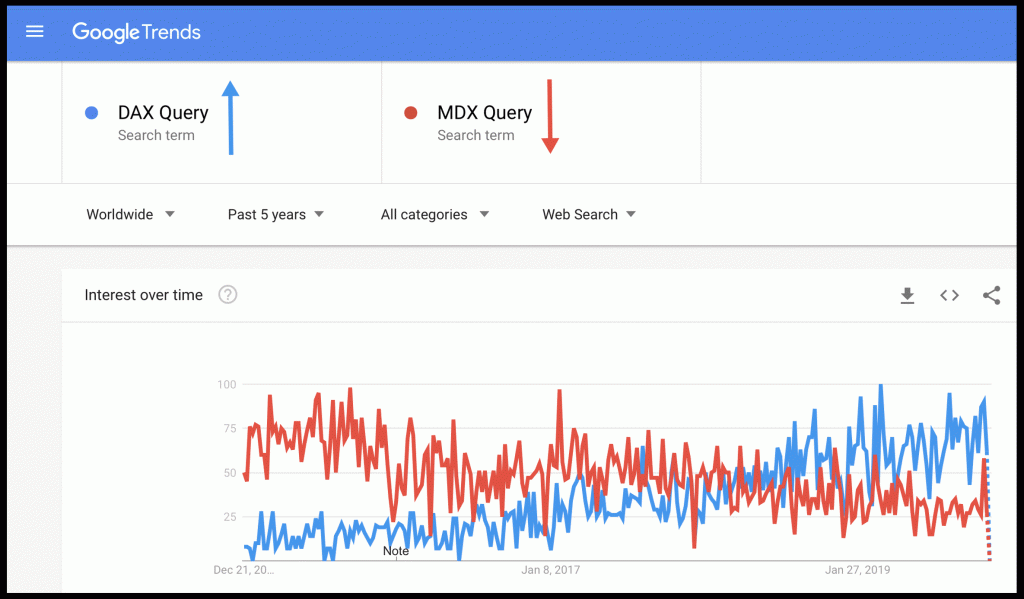
Microsoft continues to offer both types of Analysis Services (SSAS), multidimension (MDX) and tabular. An organization with a lot of investment in MDX might see benefit to continue using it. However, organizations who do not are usually adopting tabular. I did a very unscientific search of Google Trends to confirm this.

I have stated a case for SSAS Tabular, but I have left out one thing — how the data gets into SSAS Tabular in the first place. You can take either of two conceptual paths to get your data in the Tabular Model:
- Mashup. This is how the M programming language was so named (it’s not for “modeling” as is sometimes stated).
- SQL Data Warehouse. Build a data warehouse using a star schema.
Many SSAS Tabular users come to the platform after working first in Power BI. However SSAS Tabular also works as a back-end to Tableau or SSRS (and more). I am happy to talk more about this and determine whether it is something that fits in your environment.
One last thing: SSAS Tabular itself does not solve any problems. If you do not yet have your analytical data in a proper model, then that is a topic of equal importance. I can explain this to you using examples from your own data; I might even say that you need to put your data into a star schema. If this is not something you understand, I’ll help you get up to speed. Shoot me an email, or give me a call. I’ll be happy to help you make sense of all this.
